The 2026 budget cycle is here. CFOs in financial services face a clear directive: deliver measurable AI returns, not promises.
Boards want evidence that AI investments translate into financial value, risk reduction and operational scale. The days of pilot programmes justified by efficiency projections are over.
Firms that quantify their ROI with precision will secure approval. Those that can’t will face cuts.
This guide shows you how to measure, prove and present AI ROI effectively. It uses the frameworks and metrics applied by Aveni’s enterprise clients.
1. The CFO’s 2026 Dilemma: From AI Experimentation to Proven Returns
The Budget Reality
Most financial institutions have piloted AI tools over the past two years. Only a fraction have turned those pilots into production-scale success.
Boards now expect clear, quantifiable returns. Rising regulatory costs and margin pressure mean every AI investment must justify itself with hard evidence.
The new bar:
- AI spending must offset compliance and operational costs
- Every pound spent needs measurable productivity gains or risk reduction
- Efficiency claims need time and cost data to back them up
What CFOs Need to See
Your business case for AI investment must show:
- Hard financial metrics. Not speculative efficiency gains. Actual cost reductions tied to specific workflows.
- Time savings linked to labour costs. How many hours does the tool save? What does that translate to in salary costs avoided or redeployed?
- Risk reduction in monetary terms. What’s the cost of a compliance breach? How much does the AI reduce that exposure?
- Proof of scale. Benefits can’t stay locked in a single pilot. Show how gains extend across departments and grow with adoption.
2. The Financial Services AI ROI Framework: Four Pillars of Measurement
Pillar 1: Direct Labour Cost Savings
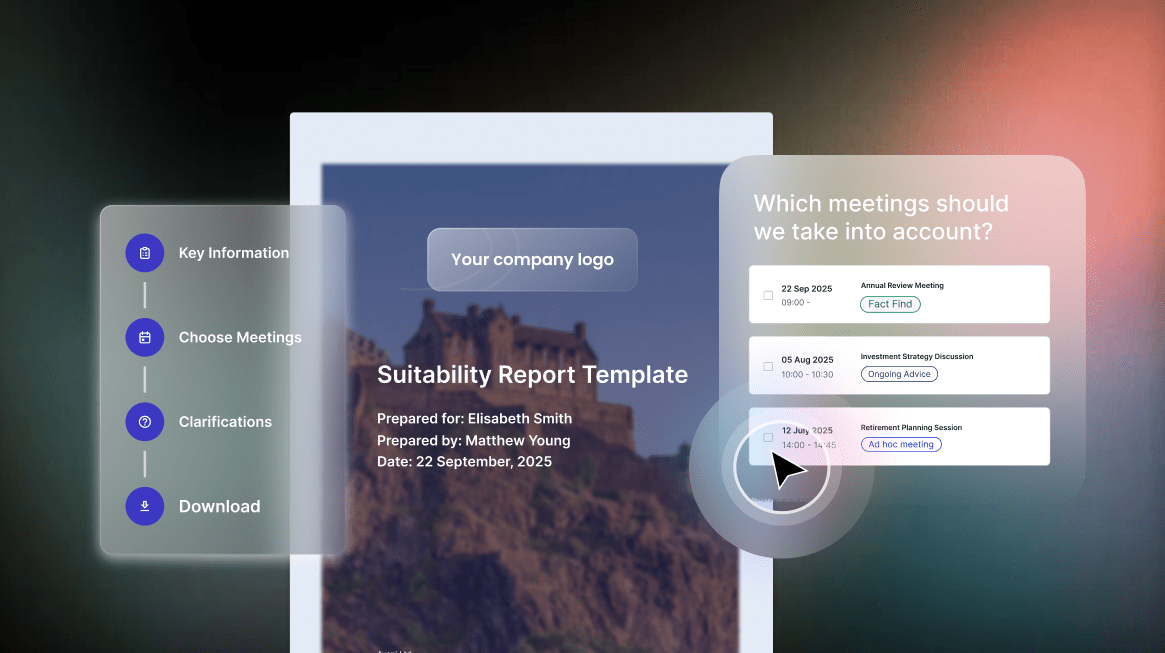
Aveni Assist reduces report creation and review time by up to 75 percent per client meeting.
Here’s how that translates to cost savings. An adviser earning £50 per hour saves 45 minutes per meeting. Across 20 meetings each month, that’s £750 in monthly savings per adviser. This calculation doesn’t yet include paraplanner time.
Formula: Adviser hourly cost × time saved per meeting × number of meetings
Pillar 2: Operational Efficiency Gains
One advice network using Aveni Assist cut report generation time from 105 minutes to 15 minutes. That saved 15,000 hours annually, representing approximately £450,000 in adviser time.
This shows how automation compounds across large teams. It directly influences capacity planning and workforce allocation.
→ Discover how Aveni Detect identifies workflow patterns across your advice network
Pillar 3: Compliance Risk Mitigation
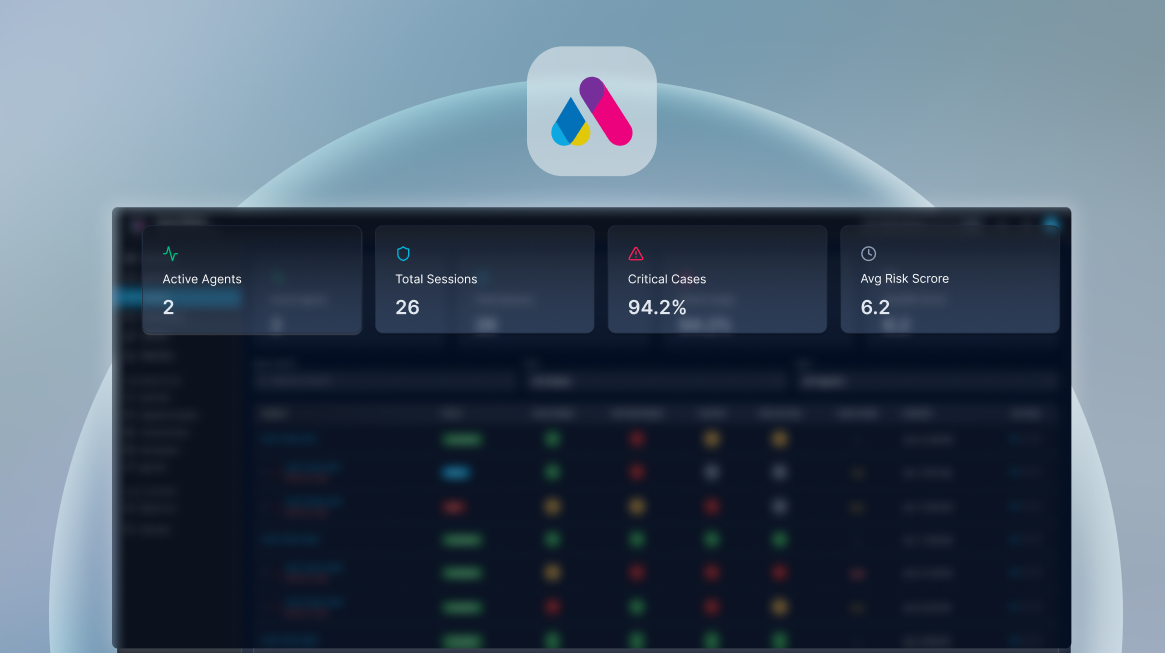
Aveni Detect replaces manual monitoring with automated QA dashboards. These surface risks, evidence Consumer Duty compliance and reduce audit preparation time from days to minutes.
Key ROI indicators include:
- Fewer regulatory breach costs
- Reduction in audit preparation hours
- Improved Consumer Duty reporting confidence
Pillar 4: Revenue Protection and Growth
AI that frees advisers from admin creates measurable revenue lift.
Your costs grow slower than your revenue:
- Adviser capacity increases, allowing more client meetings
- Faster turnaround improves client satisfaction and retention
- You scale without adding headcount at the same rate
→ See how firms turn compliance from cost centre to value driver
3. Building Your 2026 Business Case: The CFO’s Measurement Playbook
Pre-Implementation Baseline Metrics
Before deployment, capture these numbers:
- Time spent per role on administration
- Average cost per compliance or suitability report
- Error rates in manual data processing
- Overtime costs linked to reporting or audit preparation
Without a baseline, you can’t prove improvement.
Post-Implementation KPIs That Matter
Immediate (0 to 3 months):
- Time-to-value measurement
- User adoption rates (Aveni clients typically achieve 80 percent within 30 days)
- Reduction in time for report generation or QA workflows
Medium term (3 to 12 months):
- Cost per transaction improvement
- Adviser time reallocated to client activity
- Audit preparation time reduced by more than 60 percent
Long term (12 months and beyond):
- Total cost of ownership versus legacy systems
- Revenue per adviser uplift
- Improved satisfaction scores tied to faster client delivery
4. Common CFO Mistakes in AI ROI Measurement (and How to Avoid Them)
1. Measuring activity, not outcomes
Wrong: “AI processed 1,000 documents.”
Right: “AI reduced document processing costs by £X per month.”
2. Ignoring implementation costs
Include training, integration and change management expenses in ROI calculations. Hidden costs kill credibility.
3. Overestimating time-to-value
Realistic benchmarks show measurable returns within 90 days for well-implemented AI projects. Don’t promise miracles in month one.
4. Undervaluing risk mitigation
The average compliance breach in UK financial services can cost hundreds of thousands of pounds in remediation, monitoring and oversight. Factor that into your calculation.
5. Industry Benchmarks: What Good AI ROI Looks Like in Financial Services
Time Savings Benchmarks (based on Aveni client data)
- Administrative task reduction: 60 to 80 percent
- Report generation: 85 to 90 percent time reduction
- Data accuracy improvement: 95 percent or higher
Cost Reduction Targets
- Year 1: 15 to 25 percent process cost reduction
- Year 2: 30 to 40 percent efficiency gain as adoption scales
- Year 3: Full ROI realisation with wider integration across departments
Adoption Success Metrics
- 80 percent or more user engagement within 30 days
- Compliance improvement measurable within 60 days
- Client satisfaction increase of 10 to 15 percent due to faster service
→ Compare your firm’s AI maturity with industry leaders
6. Presenting AI ROI to Your Board: The CFO’s Communication Strategy
The Three-Slide Rule
1. Current State Costs: Quantify inefficiencies and manual process expense.
2. Post-AI State: Present measurable improvements with confidence intervals.
3. Implementation Timeline: Show milestones and KPIs with quarterly tracking.
Board-Ready Metrics Dashboard
- Monthly cost tracking versus baseline
- Compliance risk score improvements from Aveni Detect
- Adviser productivity metrics
- Client satisfaction correlations
Risk Mitigation Evidence
- Audit trail and Consumer Duty oversight metrics
- Evidence of data traceability through FinLLM-powered transparency
- Documented improvements in operational resilience
→ Learn why leading firms trust Aveni for compliance automation
7. 2026 Budget Approval: Your AI Investment Checklist
Financial Justification
- Baseline metrics established
- ROI projection showing payback within 12 months
- Quantified risk mitigation value
- Scaling cost projections included
Implementation Readiness
- Change management budget secured
- Success metrics defined and agreed
- Vendor selection based on proven client outcomes
- Pilot results documented and benchmarked
Board Presentation Ready
- Summary slides prepared
- Industry benchmark data included
- Risk register and mitigation plan complete
- Success milestones mapped across 2026
→ Explore how enterprise AI delivers measurable results
Conclusion: From Experiment to AI ROI in Financial Services
Going into 2026, one thing is certain: CFOs who can prove the return on their AI investments will keep budgets intact. Those who can’t will struggle to justify spend. The firms securing board confidence do three things well: (1) they measure from day one, (2) set clear baselines, and (3) choose AI partners who can evidence real, traceable outcomes.
Next Steps
-
Establish your baseline metrics this quarter.
-
Identify your most measurable AI use cases.
-
Partner with a provider that proves ROI through data, not claims.
-
Build your 2026 AI business case now.
CFOs: Turn AI into a measurable return
The 2026 budget cycle demands evidence, not pilots. Show your board a clear business case with tracked savings, compliance proof, and enterprise-wide ROI.
